
Step 2: Write a Question
Plan your questions first
Before you write, take stock of what's in the image. Some images hold several detailed charts that support deep reasoning; others only look complex.
- Go past the surface. "This is a bar graph with 7 bars" is not a question.
- Ask what the bars represent, whether there's a clear trend, and what the connections in the data imply.
- Information-rich images can support more than one annotation. See Additional Annotations.
A strong prompt is not just difficult. It is clear, image-dependent, objectively answerable, and designed to expose a real model failure.
Your questions must be clear, intelligible, and relevant to the image. We're training the model to reason, not just recognize. Questions must force the model to "think through" visual data step-by-step.
Answer accuracy and prompt clarity are the two most common error categories on this project. Before submitting, double-check that your answer is correct and that your question has one clear, unambiguous answer.
Ask yourself: "If I gave this image and question to 10 random people, would they all get the same answer?" If not, rewrite!
Part 1: Skills Ontology
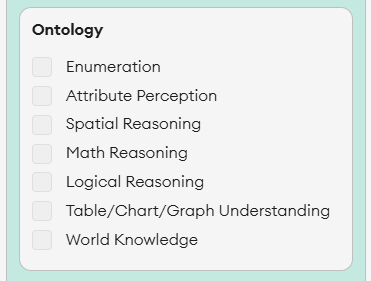
An ontology is simply the list of reasoning skills we use to label each annotation. Each skill (or "ontology") names one kind of thinking a question needs, such as counting, reading a chart or reasoning about space. You tag the ones your question actually needs. See Key Terms for more.
Tagging skills helps us analyze where the model is weak (e.g., "great at counting, bad at spatial geometry").
Skills ontology reference
The ontology splits into two groups: three required anchor skills (tag at least one) and the supporting skills you add on top to reach the 2-3 skill minimum. If Enumeration is chosen, you must select 3 skills in total, including at least one anchor skill.
| Anchor skill | What it means |
|---|---|
| Logical Reasoning | Reasoning steps that require logic: drawing conclusions, recognizing patterns, or testing assumptions. |
| Table/Chart/Graph Understanding | Understanding and interpreting visual representations of interconnected values. Table/chart/graph attributes such as x-axis or y-axis do not qualify on their own. |
| World Knowledge | Public information outside the image, such as the number of sides on a stop sign, minutes in an hour, or the value of pi. World knowledge should remain timeless, should not reference changing facts, and must be relevant to the image. |
| Supporting skill | What it means |
|---|---|
| Enumeration | Counting the number of specific objects or listing them one by one, without being excessive. The maximum allowable count is 50. If you tag Enumeration, you must tag 3 skills total instead of the usual 2. At least one of which is an anchor skill. |
| Attribute Perception | Recognizing color, shape, and other descriptive attributes. Letters and numbers are not part of attribute perception, but recognizing case sensitivity is. |
| Spatial Reasoning | Perceiving the location of objects or areas and mapping them to corresponding values, including chart positions, 2D/3D geometry, depth, and relative position. |
| Math Reasoning | Calculations, greater/lower than comparisons, min/max, sum, difference, average, median, variance, and similar quantitative reasoning. Spotting an increase or decrease is a comparison, so 'how many year-to-year decreases occur' is Enumeration plus Math Reasoning plus Table/Chart/Graph Understanding. |
Checklist
0 of 3 complete
Prompt-quality rules
Complex enough
A good prompt requires reasoning, not just recognition.
Every question must challenge the model on at least 2 skills. Tasks involving enumeration require 3+ skills. Every prompt must use at least one of Logical Reasoning, Table/Chart/Graph Understanding, or World Knowledge. Where the image is rich enough, trivial-only prompts get downgraded.
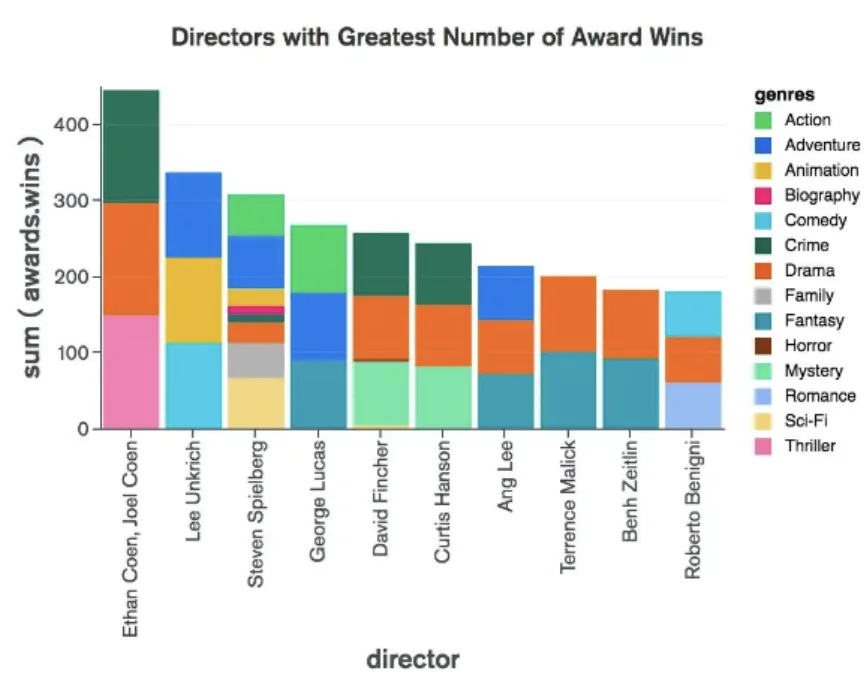
What is the average number of the genres of movies made by directors who have worked in drama genres? Round to the nearest whole number and state the answer as an integer (e.g., 3).
How many directors are shown in the chart?
The bad question only uses Enumeration. The good question uses Table/Chart Understanding, Logical Reasoning, Enumeration, and Math Reasoning.
On an image with several panels, always name the panel by its title or position ('In the Bar panel, top left, ...') and only refer to series that appear in that panel. A prompt that says 'Dataset 2' on a dashboard where three panels carry Dataset 2 has three answers and fails.
Annotation structure
A tight, predictable structure helps cut ambiguity. When the setup, the ask, and the answer format each sit in their own place, there is far less room for the model. Or a Reviewer. To read the prompt more than one way.
Broadly speaking, annotations should look something like this:
| Component | What it does |
|---|---|
| Commands | Set up the reasoning. They point the model at the relevant part of the image and lay out any constraints, filters, or steps it has to apply before answering. Commands should never hand over information. Point to where it lives in the image and make the model find it itself. |
| Final Question | Asks for the single thing you want back, and names the answer format (units, ordering, rounding) so there is only one valid response. Do not offer a variance or tolerance range, such as accepting any value within 5%: that creates multiple accepted final answers. Rounding must yield one verifiable answer. Chartography exception: estimated gridline values may use a stated accepted range or tolerance when the task category says Chartography. It does not need a question mark. An imperative like "List the numbers from largest to smallest, separated by commas" is fine, as long as the ask is unmistakable. |
| Example Answer | A short sample answer included in the prompt to show the expected format. It must not be the actual correct answer. It only demonstrates shape. Write it exactly as (e.g., X). Periods after the "e" and the "g", a comma, then your example answer in place of X. |
The question field should contain the prompt text and nothing else. Do not include labels like "Annotator question:", wrapping quotation marks around the entire prompt, or any other surrounding formatting.
Avoid first-person language ("I", "me", "we", "our") and second-person language ("you", "your"). Instead of "Can you tell me how many bars are above 50?", write "How many bars are above 50?"
Check for at least 2 reasoning steps. Tagging a required skill usually makes a question non-trivial. If it still feels trivial, count the reasoning steps. A question that takes only one step (like reading a value, or reading a value and doing simple arithmetic) is likely trivial.
Don't make the model count more than 50 items. Only count what the model would consider based on the prompt. Counting by area is fine. A 10×10 grid can be counted as 10 × 10 instead of one square at a time.
Part 3: Answer Types
Choose Short Answer for most annotations. Across your submissions, aim for about 90% Short Answer and 10% MCQ. Both types must have one clear answer and follow the format rules below.
No answer variance or tolerance ranges. Accepting several values, such as “any value within 5% is acceptable,” creates multiple final answers and is unacceptable. Specify a rounding rule that produces one verifiable final answer.
Chartography exception: If the task category says Chartography, an estimated value read from gridlines may use a stated accepted range or tolerance, and the model's wrong answer must fall outside it. All other tasks keep this rule. See Announcements.
Make most prompts ask for a numerical answer when the image supports it. Request the number directly as Short Answer, rather than listing choices. This fits the target of about 90% Short Answer and 10% MCQ across submitted annotations. Exact chart labels are also valid short answers.
Short answers expecting a text response should be 1–5 words long and unambiguous. If you ask for a list of words, keep it to 5 words or fewer and explicitly request the ordering (alphabetical, increasing length, etc.). If the same set of answers in a different order would also be valid, the prompt has multiple answers and is ambiguous.
Numerical answers must also have one accepted final value. Do not allow variance or tolerance ranges such as “any value within 5% is acceptable.” Even with whole-percent rounding, that range accepts multiple final answers and is unacceptable; use rounding that yields one verifiable answer.
Chartography exception: If the task category says Chartography, an estimated value read from gridlines may use a stated accepted range or tolerance, and the model's wrong answer must fall outside it. All other tasks keep this rule. See Announcements.
You must include an example answer in your short-answer prompt to ensure single-verifiability (the example answer must not be the same as the rewrite/correct answer. That would be a giveaway).
The example answer format must follow this format exactly:
(e.g., X)
where X is a representative answer that dictates the format of the model's output. It must never match the Rewrite Answer, as that counts as a giveaway.
Thousands separators, dollar signs, percentage signs, and units must be explicitly requested in the example answer if they are necessary:
- "Answer as a whole number with comma separators (e.g., 1,200)."
- "Answer as a dollar amount (e.g., $45)."
- "Answer as a percentage (e.g., 30%)."
- "Answer in kilograms (e.g., 5 kg)."
Comma- or hyphen-separated items each count as one word (e.g., "A-1, B-4, C-2" is 3 words).
No special characters in the Rewrite Answer, such as Greek letters or accent marks.
Zero is an acceptable answer.
True/False and Yes/No questions are not allowed.
Do not ask about color in short answer prompts. Color naming is too subjective to have one correct answer. If your prompt involves color, write it as an MCQ so the options define the answer. Avoid comparing similar shades (e.g., light blue vs. dark blue) entirely, in any format.
Example.
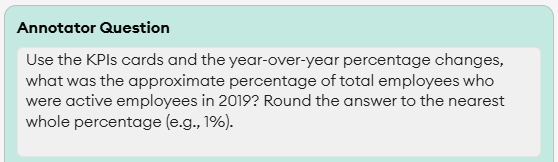
Click to see full Annotator Question section
Knowledge check
A fellow tags Enumeration and Attribute Perception on the following prompt. Is it valid?
Count the red bars in this chart. Answer as a single number (e.g., 5).